In real estate, timing and knowledge are everything. Whether you’re buying your first home, moving up, investing, or preparing to sell, having a clear grasp of current market trends is what separates guesswork from smart decision-making. These trends go far beyond buzzwords and media headlines—they reveal what’s actually happening in your neighbourhood, at your price point, in real time.
In the fast-changing Vancouver real estate landscape, where demand fluctuates rapidly and micro-markets behave differently block by block, understanding the nuances matters. A single month’s shift in inventory or a trend in price reductions can signal an opportunity—or a warning sign. But without the right data, you’re flying blind.
That’s where in-depth, hyperlocal market analysis becomes essential. It empowers you to time your decisions well, price your property effectively, and negotiate with confidence. Whether you’re a buyer trying to spot value or a seller trying to maximize returns, knowing the numbers gives you leverage.
As a REALTOR® and founder of StatsPRO, I’ve built my approach around equipping my clients with this kind of clarity. I want you to feel grounded, not guessing—so here’s a breakdown of the most important numbers to watch, and what they can tell you.

Kate Jackson, REALTOR®
eXp Realty
109 Lonsdale Avenue
North Vancouver, BC
V7M 2E7d
Final Thoughts
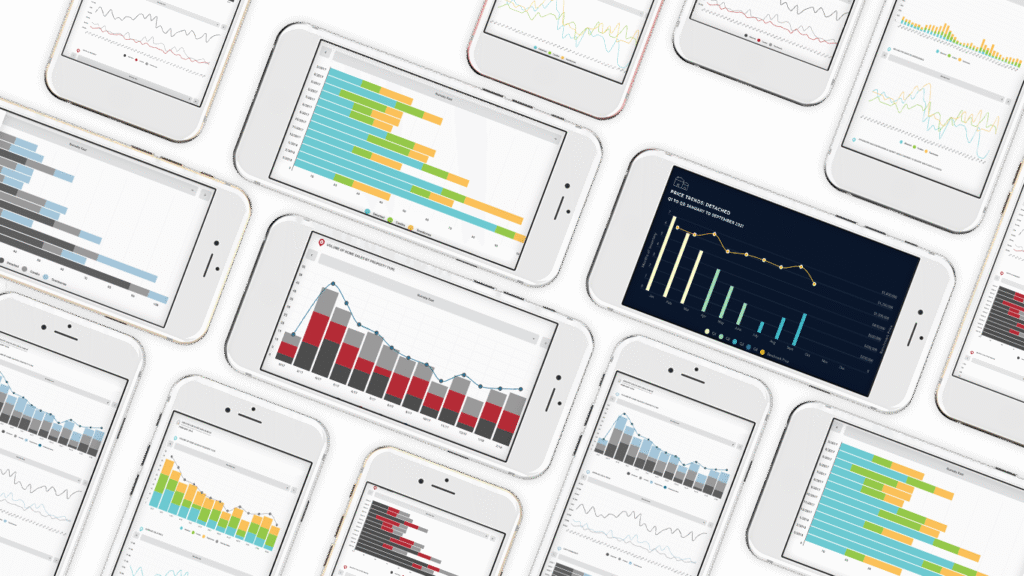
Understanding these numbers doesn’t require a background in economics—just the right tools and support. Market trends are your roadmap, and when you know what to look for, you make better, faster, more confident choices. My clients receive customized StatsPRO reports tailored to their needs—delivered in plain language, with clear visuals and actionable insights.
If you’re ready to navigate your next move with strategy and clarity, I’m here to guide you. Real estate doesn’t have to feel like a gamble—it can feel like a plan.